
The question: Can a useful diagram answer a search better than another 2,000-word article? That is what JX Lab wants to test—not whether Google has a secret preference for pictures.
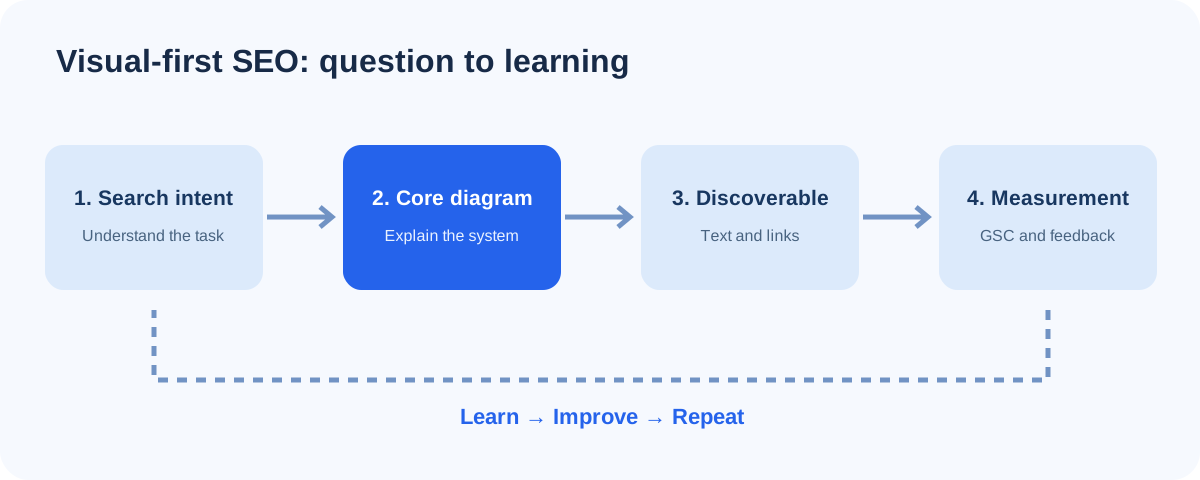
1. See the whole process first
Search intent → Useful visual answer → Crawlable explanation → Discovery → Measurement → Improvement. The real job of the diagram is to make the relationships visible. The job of text is to explain context, exceptions and evidence, and to ensure important information is accessible.
2. Traditional article vs visual-first article
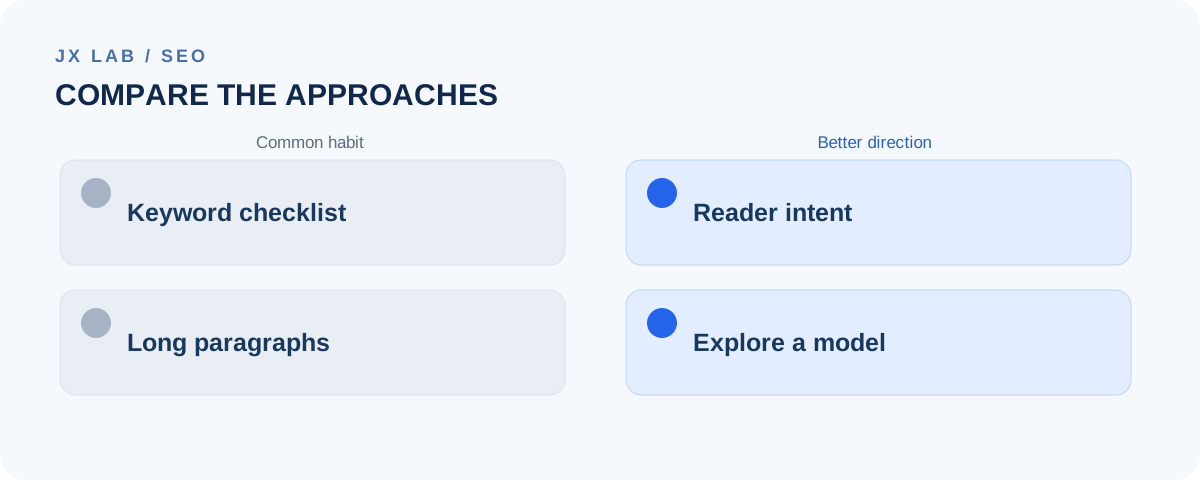
| Decision | Text-heavy SEO habit | Visual-first experiment |
|---|---|---|
| Starting point | Keyword list and target length | What must the visitor understand or decide? |
| Core deliverable | Long explanations and repeated definitions | One diagram that models the real process |
| Depth | More paragraphs | Inspectable steps, examples, conditions and trade-offs |
| Search accessibility | Headings and metadata | The same foundations, plus meaningful text equivalents for visuals |
| Success | Ranking alone | Relevant discovery plus demonstrated reader usefulness |
This comparison is an editorial design hypothesis. A detailed textual article may still be the better answer for some queries. We choose the format that explains the problem accurately, not the format that looks most impressive.
3. Walk through a real example
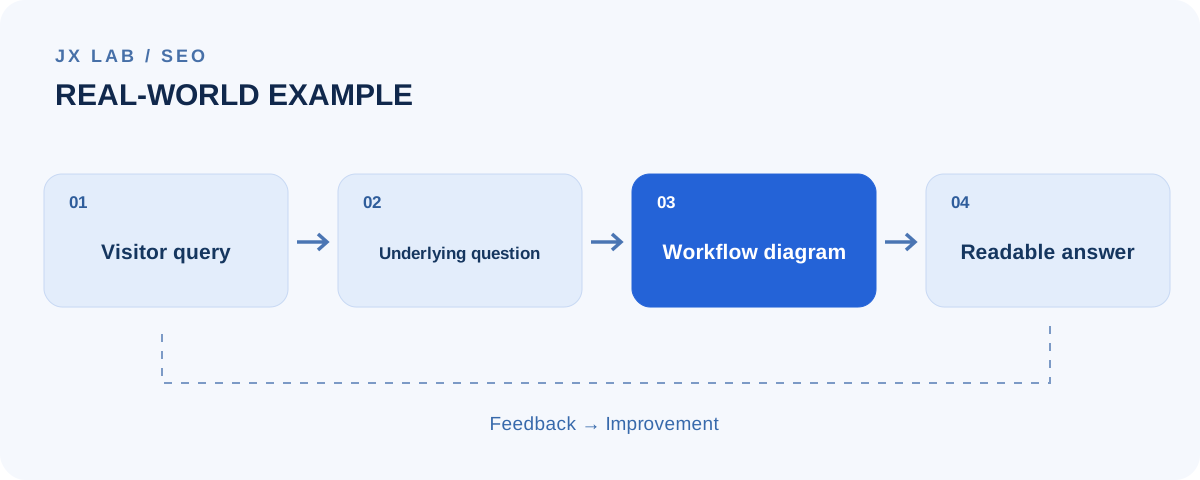
Take the question: “How should a small clinic choose a CRM?” A generic feature list is easy to write, but it doesn't explain where the CRM fits into the clinic's existing workflow.
Booking request → Appointment confirmed → Visit recorded in existing system → Follow-up eligibility → Patient communication.
Inspect the nodes
- Booking request: Where does it originate—phone, website or reception? Who owns the appointment record?
- Confirmation: How do cancellations, rescheduling and duplicate bookings behave?
- Visit: Which clinical facts stay in the HIS/POS, rather than being copied into the CRM?
- Follow-up: What consent and operational conditions must be met before messaging?
- Measurement: Which outcomes mean the workflow improved: fewer missed appointments or faster staff handling?
A diagram can expose system boundaries and missing decisions at a glance. The short explanations make each node actionable. The same method works for technical architecture, business operations and decision guides.
4. What Google actually says—and what it does not
Google recommends creating helpful, reliable, people-first content and making it easy to crawl, understand and navigate. It does not specify a preferred word count. None of this proves visual articles rank better than conventional articles, and a diagram that is only an image without a readable explanation can make content less accessible.
Read Google's primary references: Creating helpful, reliable, people-first content, SEO Starter Guide and Ask Google to recrawl your URLs.
5. Our SEO experiment: what we will actually measure
| Stage | Evidence | Question |
|---|---|---|
| 7 days | URL Inspection / crawl status | Can Google discover and process the article? |
| 14 days | Indexing state, first query impressions if available | Is the article surfacing for relevant intent? |
| 28 days | Queries, impressions, clicks, CTR, average position | What interpretation is Search making of the page? |
| 56 days | Query patterns, content revisions, onsite feedback if available | Which explanation or diagram needs improvement? |
The checkpoints are observation windows, not guaranteed timelines. Search Console data can be sparse, and indexing does not imply ranking. We will record changes, avoid pretending that comparisons across different topics are controlled experiments, and use the results to improve the content.
The takeaway
Model the problem first. Make the explanation visible. Keep it readable. Measure what happens. Visual-first SEO is our hypothesis for making useful knowledge easier to understand—not a claim that graphics are a ranking shortcut.